For any application in which DC motors are used, the effects of temperature must be taken into account when selecting the right motor. When the temperature changes, performance changes. When looking at DC motor curves, one must ask the question: ‘Do these curves represent motor performance at room temperature or at the maximum rated temperature?’. Depending on the temperature and the required operating point on the motor curve, the performance difference between ‘cold’ and ‘hot’ can be significant.
Once an engine design has been finalised, including engine dimensions, magnetic circuits and windings,
several characteristics that determine motor performance are ‘theoretically’ fixed: the
torque constant (KT), the voltage constant (KE), and the motor terminal resistance (Rmt). These three values determine the output torque, motor speed, and resulting output power at any point on the motor curve at a given terminal voltage, as well as the overall slope of the motor curve.
Engine constants are not really constant
The torque and voltage constants are determined during the design phase and are a function of the overall design of the magnetic circuit. They are always the same when using SI units. For example, if motor KT = 0.1 Nm/A, then motor KE = 0.1 V/(rad/s), assuming that Nm and V/(/rad/s) are the units used. The resistance of the motor terminal is also determined during the design phase by the number of coils, the number of coil turns and the diameter of the magnet wire. These principles apply to both brushed and brushless DC motors.
However, the term ‘motor constants’ is somewhat misleading. The ohmic resistance of the winding and the flux density of the permanent magnet change as the temperature changes. As the motor temperature increases, the motor winding resistance increases, based on the temperature coefficient of copper. The flux density of the permanent magnets will decrease along with the temperature. Changes in these two main components of the motor will result in an increase in no-load speed and a decrease in starting torque, changing the slope of the motor curve. Once this concept is understood, it becomes clear that motor performance at room temperature differs significantly from performance at maximum temperature.
The DC Motor Curve
DC motor performance curves can be developed for different conditions. For example, the motor curve in Figure 1 shows an open-loop motor that has been tested quickly (to prevent overheating) on a dynamometer (torque meter). The test is performed by quickly loading the motor from no load to stalled rotor (stall), using a fixed clamp voltage from a low output impedance power supply. This type of test is performed to obtain a “baseline” of motor performance at room temperature. Motor speed and current are plotted as a function of torque. From this test and a number of resistance measurements, the torque constant, voltage constant and end resistance values can be determined. This information is very useful for estimating basic motor performance, for example for an application where the motor runs for only a short time and with a long rest period between each work cycle (low duty cycle).

In applications such as repeated point-to-point movements, applications that require frequent starting and stopping of high inertia loads, or applications where the motor runs for long periods of time (such as a fan), the motor performance data at room temperature is not sufficient and may lead to the selection of an incorrect motor or to the maximum permissible temperature being exceeded and the windings burning out (or frequent activation of the thermal protection).
As the motor temperature rises, resistance increases and the torque constant and voltage constant decrease. This results in an increase in no-load speed and a decrease in starting torque. Figure 2 illustrates the difference between “cold” and “hot” operating conditions for the same DC motor. The “hot” motor curve shows how much performance can change when operating the motor at an elevated temperature.

Temperature effects on the resistance of the motor winding
Motor winding resistance (R_mt) is the main cause of heat generation in the motor. In order for an electric motor to generate torque, current must be driven through the motor windings. Copper is an excellent conductor, but it is not perfect: material physics and impurities will cause the atoms to vibrate faster as more current flows. The result is a constant increase in the temperature of the motor windings. All metal conductors have a positive temperature-resistance coefficient. This means that as the temperature increases, the resistance of the material also increases. Electric motors usually use copper as the conductive material, except in special cases. Many squirrel cages of induction motors are made of cast aluminium because of the ease of production, but the vast majority of motors use copper wire.
Table 2 gives examples of commonly used metals in electrical and electronic devices and their respective temperature coefficients (α).

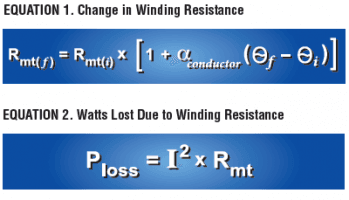
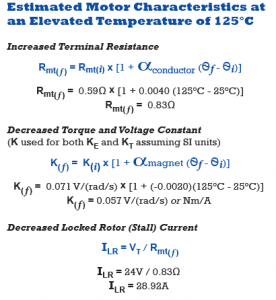
Equations 1 and 2 illustrate the relationship between winding temperature ( ), winding resistance (Rmt) and lost Watts (P). Here, ‘i’ is the value at low temperature and ‘f’ is the value at high temperature.
Temperature effects on magnetic flux density
The coupling constant (KT) and the stress constant (KE) are directly related to the magnetic flux density (Br) of the permanent magnets. Depending on the magnet material used, the total flux density will change by a certain percentage when the temperature increases.
As the temperature rises, atomic vibrations cause some magnetic moments to “randomise”, resulting in a decrease in magnetic flux density.
Assuming that the motor is used within the specified limits, the decrease in flux density is temporary and will begin to recover as the magnet cools down. If, on the other hand, the maximum temperature limit of the magnet is exceeded, partial demagnetisation will occur and the motor performance will change permanently.
The values in Table 3 represent average figures for different material classes. Certain magnet types within a material class may deviate from the values given below. Some types of Neodymium, for example, may exceed the specified operating temperature of 150°C. The table illustrates the relative differences between the temperature characteristics of different materials.
If exact values are required, it is advisable to consult an application engineer at the motor manufacturer.


A frequently asked question is what the relationship between and is at elevated temperatures. When using SI units, one will always be equal to the other, and both will change equally with temperature.
If English units are used, KT and KE are expressed in oz-in/A (lb-in/A, lb-ft/A, etc.) and V/krpm. One is not equal to the other when these units are used, but both quantities will decrease in the same proportion at increased temperatures.
How does this affect overall engine performance?
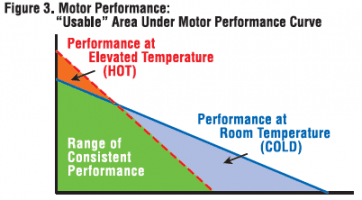
At elevated motor temperatures, the slope of the DC motor curve increases due to an increase in no-load speed and a decrease in starting torque. Figure 3 illustrates the area under a given motor curve that shows the range of consistent performance between room temperature and the nominal maximum temperature.
Another term that refers to the slope of a DC motor curve is “regulation”. Motor regulation describes how much the shaft speed will change for a given change in shaft load, at a fixed terminal voltage. A flatter speed-torque curve results in a smaller change in speed for increased load. As the motor temperature increases and the curve becomes steeper, the speed will drop more for the same increase in load.

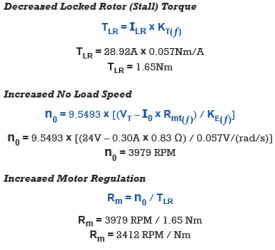
Equations 4 and 5 can be used to illustrate the strong effect on motor performance resulting from a decrease in magnetic flux and an increase in the resistance of the motor windings. In these equations, TLR is the torque at locked rotor.
Although there will be a higher no-load speed and lower starting torque, the difference in “cold” versus “warm” starting torque is greater than the difference in “cold” versus “warm” no-load speed.
The starting torque is highly dependent on the resistance (Rmt) and the torque constant (KT).
Although the no-load speed is also affected by the higher resistance at an increased temperature, the resistance factor has a much smaller effect on the no-load speed. This is because it is multiplied by the no-load current (I0), a relatively small number (see also equations 5b and 5c).


The user must exercise caution when designing the system to ensure that the shaft speed meets the minimum specification at a given load at elevated motor temperature. In a more complex motion system with a closed-loop controller, the speed can be controlled within a certain range to remain “fixed” while the load changes.
The following example assumes that the motor is used in an open loop with a regulated DC terminal voltage.
How much can engine performance change under a given set of conditions?
Terms and conditions:
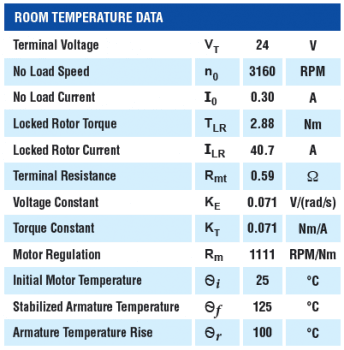
- The initial engine data was compiled using a rapid dynamometer test at a room temperature of 25°C;
- The temperature of the anchor has stabilised at 125°C under constant load;
- No heat sink or forced airflow was used;
- The motor was used in an open-loop configuration (no feedback to control the output power of the shaft).
- Power supply used – regulated, 50A max power with low output impedance;
- Copper motor windings;
- Strontium ferrite (ceramic) permanent magnets.

With a 100°C increase in the stabilised temperature of the armature, the end resistance will be higher and the magnetic flux lower compared to the initial motor temperature of 25°C. This will result in a change in Rmt, KT and KE.
Important note: the following calculations assume that the temperature of the permanent magnets and that of the rotor are identical. The motor armature (rotor) is the part of the machine that carries electrical current and will always have a higher temperature than the permanent magnets. In practice, the actual changes in K_T and K_E and in the regulation are less pronounced than what is suggested in the following example.

It is interesting to see how much performance has changed with a given increase in engine temperature. Although the analysis is useful for understanding the phenomenon, it is not entirely accurate. There are a few things to keep in mind, for example:
- We assumed a stabilised increase of 100°C on all components of the motor. In practice, all parts will stabilise at different temperatures, with the motor armature being the hottest.
- The temperature coefficient for the magnetic material was an average used for that material. In reality, the different grades of a particular material class have values that deviate slightly from the average.
- The actual thermal model of a DC motor is extremely complex. It is very difficult to obtain theoretically exact values, because there are simply too many variables to take into account.
However, the preceding analysis is very useful for understanding the limitations of the motor in a particular application.
Engine constants and maximum output power
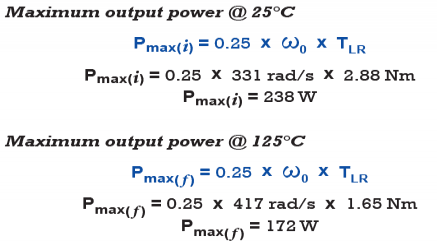
An engine is rarely, if ever, used at maximum power for long periods of time. With the exception of very small, low-power engines, most engines cannot be used continuously at maximum power without exceeding their maximum temperature. The equations below can be used to determine the maximum output power and the power at any point on the engine curve.

Equations 6b and 6c illustrate the effect of motor resistance on the output power of the machine. Although it may not seem intuitive when looking at equation 6b, higher winding resistance is the main culprit in reducing the maximum output power of the motor.
Although the magnetic flux density is reduced at an increased temperature, the decrease in TLR (due to smaller KT) is compensated by an increase in ω0 (due to smaller KE).
If the resistance remained the same, even a decrease in magnetic flux density would not significantly change the maximum output power of the machine.
In reality, the combination of higher resistance Rmt and lower magnetic flux density (lower KT) reduces the starting torque much more than simply a reduction in magnetic flux density alone, which causes the reduction in maximum output power.
In this case, the maximum power at elevated temperature is approximately 70% of that at room temperature. This is a significant change, and it is a direct consequence of the increased motor resistance. Equation 6c gives results that are 1 to 2% higher than the figures above. This equation is very useful for quickly estimating the maximum power of any DC motor.

Engine curves come in many varieties!
Most graphs of DC motor performance show at least two curves: speed versus torque and current versus torque. Manufacturers may display this information in different ways and sometimes also provide other information such as output power and efficiency curves.
The engine curve in Figure 1 removes all other variables and assumes that the engine has been tested under fixed terminal voltage with a low impedance power supply and then progressively loaded with a dynamometer. The test is performed as quickly as possible to minimise the rise in motor temperature. If the motor being tested has a low power rating, the dynamometer can load the motor until the shaft speed reaches zero or near-zero RPM. For larger motors, the dynamometer can be set to gradually load the motor to its maximum power. The rest of the curve can then be extrapolated. In both cases, the resulting data are the (theoretically) linear speed versus torque and current versus torque curves.
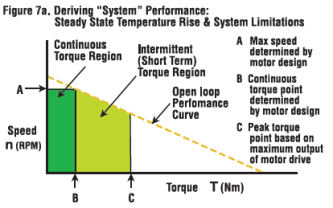
Some manufacturers, particularly those supplying complete servo systems, may present performance curves as a “blend” of information, including system-level limitations. These limitations include many things such as continuous power, peak power, drive/amplifier power limitations, maximum DC bus voltage, maximum motor temperature values, motor saturation, and mechanical speed limitations. Many manufacturers plot torque on the Y-axis and speed on the X-axis. The example curves in Figures 7a and 7b show how data may appear when factors such as maximum rotational speed, maximum temperature rise and peak drive current are taken into account. Regardless of how the data is published or what other system factors are considered, the motor parameters R_mt, K_T and K_E are crucial for understanding the true capabilities of the motor.

Another factor to consider when evaluating performance curves is that the actual test conditions are not always clear. Different suppliers may provide different information. The quick dynamometer test is very consistent and provides a good baseline. The disadvantage is that the results never represent the worst conditions. Many manufacturers plot torque on the Y-axis and speed on the X-axis. The example curves in Figures 7a and 7b show how data may appear when factors such as maximum rotational speed, maximum temperature rise and peak drive current are taken into account. Regardless of how the data is published or what other system factors are considered, the motor parameters R_mt, K_T and K_E are crucial for understanding the true capabilities of the motor.
When engines are tested at maximum rated temperature, the user will gain a better understanding of engine capacity in applications where the temperature stabilises significantly above room temperature.
The disadvantage is that there are many other variables that can influence the test results, such as the method of temperature measurement, the motor suspension (cooling effect), the air flow around the motor, etc.
Some manufacturers test their motors under the worst possible conditions: a motor stabilised at the maximum rated temperature, without cooling and without forced airflow.
There are no strict guidelines on how a manufacturer should present performance. The most important thing to remember when evaluating the data is: ask the right questions.
General engine design and heat transfer
The mechanical structure influences the heat transfer properties of the motor. In a DC motor with commutator and brushes, copper windings are wrapped around slots in the rotating part of the motor (armature or rotor). The heat generated by the copper windings is conducted through the armature laminations and to the motor shaft and bearings. The heat also migrates by convection across the air gap to the permanent magnets and the housing, where it eventually dissipates into the environment.
In the case of a brushless DC motor, the copper windings are either wound in slots (in a DC motor with slots, known as a slotted motor) or formed against a magnetic back iron (in a DC motor without slots, known as a non-slotted motor). This construction provides a direct thermal conduction path from the heat-generating copper to the housing, where the heat dissipates into the environment. In a brushless motor, the permanent magnets are located on the rotating part.
In both cases, it will be very difficult – if not impossible – to predict the increase in temperature of the individual components without empirical testing. One thing is certain: the temperature increase of the components (hotspots) of a brush motor will be different from that of the hotspots of a brushless motor.
There is no substitute for application testing.
The purpose of the above and the calculation examples is to gain a better understanding of how engine performance changes with temperature.
The conclusion is:
There is no substitute for testing and validating the motor under application conditions. A sound theoretical treatment is not feasible, or hardly feasible, due to the large number of variables and assumptions involved. The sample calculations can, however, serve as a first approximation to get an idea of the extent of the possible change.
The best way to understand motor performance under actual operating conditions is to simulate the application as accurately as possible and collect temperature data over time using a data acquisition system. The various parts of the motor must be monitored with thermometers attached to the bearings, the windings (in the case of a brushless motor), the magnets (in the case of a brush motor) and the housing. Always discuss your design criteria with an application engineer.